Problem
Lack of transparency and lack of
understanding as to:
what happens at store level and in the
supply chain in real time
how does it affect the sales
how it may cause the loss of sales in the nearest future
what can be done to save the sales and preserve profit
The retail chain where the «magic» of product movement is taking place
Auto-ordering
Replenishment
Attempt at forecast
Manufacturer
Service level
~90%
Warehouse
Store
Auto-ordering
Replenishment
Attempt at forecast
Product availability level
~80%
Shopper
The beer and bottles
case study
Thursday end-of-day stock is 10 bottles
Friday EOD stock is 12 bottles
Is everything alright?
Here is what Online Radar would show:
On Friday at 11:00 am the stock balance is 0 bottles
On Friday at 5:00 pm the stock was replenished, and is now 22 bottles
On Friday from 7:00 pm to 9:00 pm this beer wasn’t available on shelf
The enriched sales history is ready to be used to auto-ordering adaptation
The stock is not going to last until the next delivery, which is planned for Monday, so the delivery needs to happen on Saturday.
Solution
Online Radar is an online tool for offline retail that allows to monitor KPIs and detect anomalies across the entire supply chain and all processes at the store level in real time
Transparent KPIs across the entire supply chain
Assortment compliance
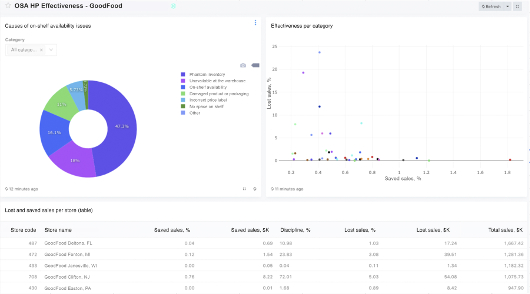
Service level monitoring
Supply chain analytics
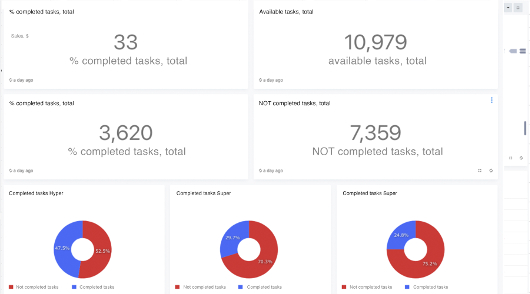
Task execution discipline
Distribution analytics
Product availability
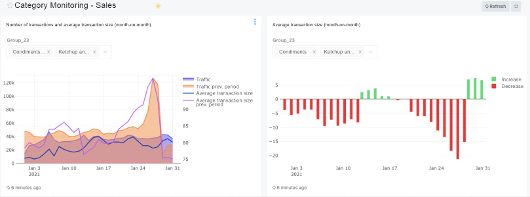
Real-time demand monitoring
Demand forecast
Image recognition for planograms
Sales plan execution
Assessment of critical inventory levels
Category management KPIs
Saved sales
Real-time monitoring of every movement of every product
Castomizable real-time analytics
How does
it work?
Online Radar allows each user to customize their own set of reports and services. At the moment, Online Radar provides the following capabilities:
1
Inventory levels at the store warehouse
Access to stock balances data at the product/store level in real time
Access to daily stock balances data at the product/store level
Access to the calculations of inventory level in days
Allows the user to estimate the inventory deficit or oversupply at the product/store level in near real time
2
Assortment matrix
Access to active assortment at the particular store at the product/store/day level
Access to daily stock balance data at the product/DC level
3
Sales and prices
Access to sales data in real time at the store/format or product/brand levels
Access to sales data in store/format, product/brand or day/week/month levels
Allows the user to track the sales dynamic of your products and make real-time decisions in order to stimulate demand
4
Write-downs at the store
Access to product write-down data and share of write-down at the unit/brand level at the store
Allows the user to control the level of write-downs and defected products/spoilage
5
Inventory levels at the distribution center
Access to daily stock balance data at the product/DC level
Allows the user to assess the inventory levels of their product at the distribution center
Results
Full transparency of all processes in the supply chain, including the stores
Manufacturer’s failure to execute
Manufacturer
Product availability level
99%
Problem with inventory at the DC
Warehouse
Store delivery failure
99%
Problem with inventory and shelf replenishment
Store
Product availability level
99%
Shopper
Current track record
27000
stores are using the service
4114
stores that are using the service in real time
Sales growth
25 - 54%
thanks to adaptation of business processes
Additional profit
150
manufacturers are using the service
05 - 15%
of total sales additional revenue from manufacturers